;stroke-width:0px;}%3c/style%3e%3clinearGradient%20id='Degradado_sin_nombre_3'%20x1='993.28627'%20y1='-179.86134'%20x2='-9.62936'%20y2='400.65514'%20gradientUnits='userSpaceOnUse'%3e%3cstop%20offset='0'%20stop-color='%23011781'/%3e%3cstop%20offset='.59897'%20stop-color='%23002fdd'/%3e%3cstop%20offset='1'%20stop-color='%230082e6'/%3e%3c/linearGradient%3e%3c/defs%3e%3cg%3e%3cpath%20class='cls-1'%20d='M896.07535,270.53973l-.00006.00004c-35.81778,20.67941-81.61781,8.40733-102.29721-27.41046L659.20706,10.04547l.00007-.00004c35.81778-20.67941,81.61781-8.40733,102.29721,27.41046l134.57102,233.08384ZM826.65058,130.29272l69.4248-120.24725v-.00006c-35.81787-20.67938-81.61792-8.40729-102.29736,27.41046l-10.36328,17.94995,43.23584,74.8869ZM728.63178,150.29248l-69.42456,120.24725v.00006c35.81763,20.67938,81.61768,8.40729,102.29712-27.41046l10.36353-17.94995-43.23608-74.8869ZM298.61936,10.56566l-37.5874,88.46433c-2.03,5.31507-3.73742,11.14089-5.12598,17.46447-1.39412,6.33007-2.59914,12.2801-3.60765,17.84544h-4.55498c-1.26991-5.56535-2.46937-11.44956-3.60765-17.65542-1.13828-6.19937-2.84756-11.95937-5.12598-17.27537L201.04228,10.56566h-73.65647l88.4634,181.48457h67.96321L372.27583,10.56566h-73.65647ZM214.33089,150.66516v121.87587h71.37991v-121.87587h-71.37991ZM559.45273,10.56566l.38005,125.67261c0,7.59349.25027,15.18698.76009,22.78047.50426,7.59349,1.13828,15.31675,1.89837,23.15958h-3.4167c-3.03851-8.09774-6.20679-15.81544-9.49186-23.15958-3.29249-7.33858-6.71104-14.0487-10.25195-20.12293l-61.508-107.44805c-4.05073-6.83433-7.84747-12.0187-11.39023-15.56702-3.54647-3.54091-9.11182-5.31507-16.7053-5.31507h-31.51224c-16.7053,0-25.05888,8.35265-25.05888,25.05888v236.91648h66.44303v-130.22852c0-7.08275-.32072-14.48714-.94919-22.2104-.63403-7.71863-1.459-15.2463-2.46751-22.59137h3.4167c2.02258,7.34507,4.55683,14.68272,7.59349,22.0213,3.03665,7.34414,6.07516,14.17847,9.11182,20.50298l64.16461,111.62392c3.79674,6.83433,7.5286,12.02519,11.20114,15.56702,3.66697,3.5474,9.30277,5.31507,16.89625,5.31507h31.89228c16.44947,0,24.67884-8.35265,24.67884-25.05888V10.56566h-65.68479ZM119.91841,279.6364c-25.47719-10.88605-45.03144-34.07385-45.03144-74.8869V75.8357C74.88698,34.47681,41.35897.9488.00007.9488h-.00007v203.8007c0,41.35889,33.52801,74.8869,74.8869,74.8869h45.03151ZM182.27302,276.53045v.00007h0s-23.85712,0-23.85712,0c-37.80944,0-69.81178-28.87333-72.61406-66.57879-.05642-.75919-.10384-1.52513-.14206-2.29786h27.73668c38.03948,0,68.87656,30.83709,68.87656,68.87656Z'/%3e%3c/g%3e%3c/svg%3e)
COMMUNICATIONS The communication health of your assets, live.
A dropped link does not announce itself: you find out when the data is missing, and by then it is already missing.
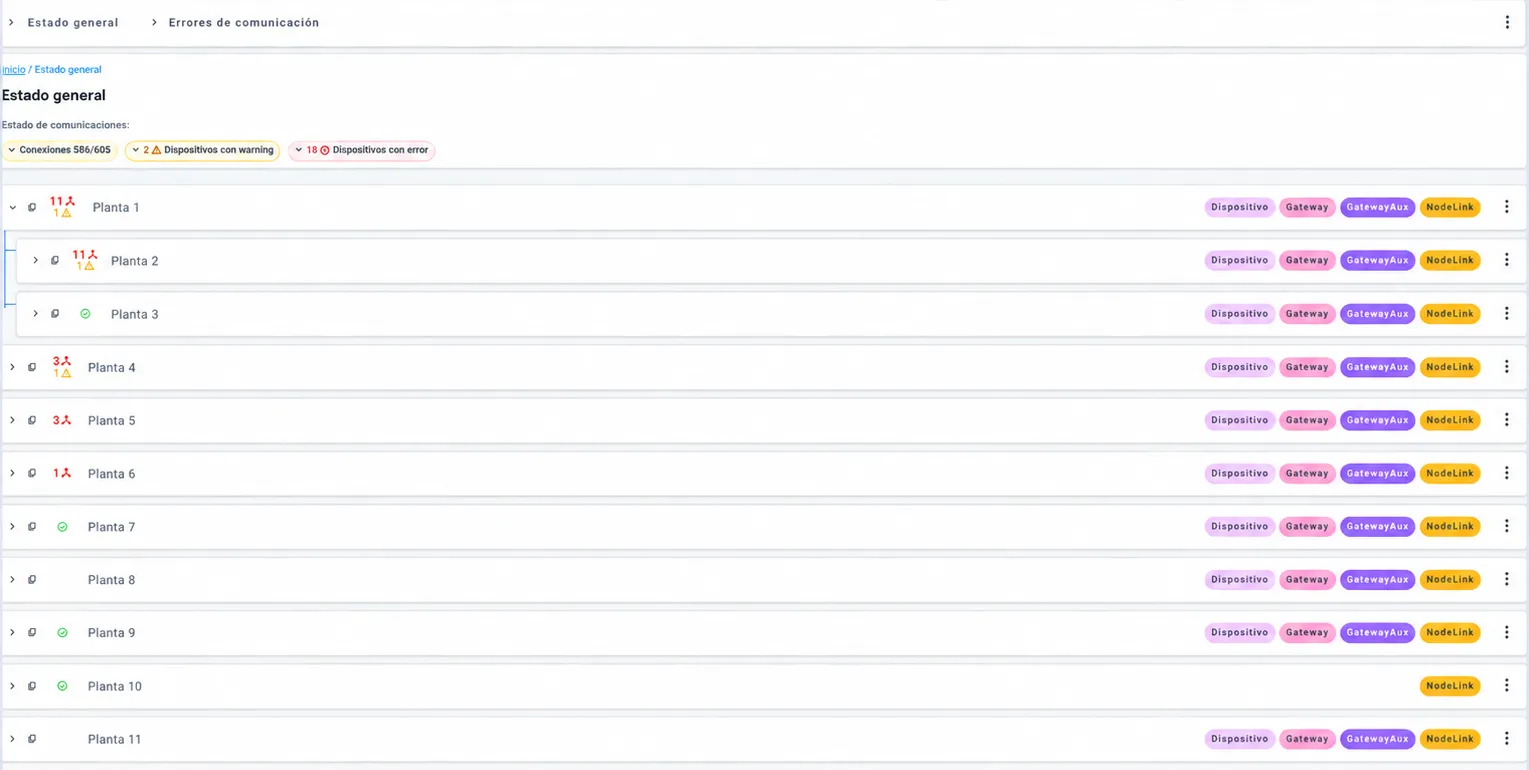
Communications, included in the Lynx core, monitors the communication status of every asset in the plant: active connections, devices in warning or error and hierarchical health per site, in a single general status view.
AT A GLANCE What has stopped talking, right now
The general status summarizes communication across the whole network and allows drilling into every connection, device and site.
- Active connectionsLive connections vs. the total configured (e.g. 586/605).
- Devices in warningAssets with degraded communication worth keeping an eye on.
- Devices in errorUnresponsive or down assets, listed with their reason.
- Hierarchical healthAggregated status by country, site and asset, navigable as a tree.
- Scan windowThe time cycle in which each connection is evaluated.
- Node typesDevice, Gateway, GatewayAux and NodeLink for every asset.
Connection status What is not responding, found by name
Status of every plant connection with a clear colour code: green if it communicates, red if it is down. Search by name to immediately locate what is not responding.
- Chile (fibre) Gateway
- North Plant Bus 01
- Reactor Bus 14
- Boiler steam node 07
- Mixing Line 02
- Temp. Sensor B
- SYS/PLT/NOR/P01/N02/UV3_1-P1
- SYS/PLT/NOR/P01/N02/UV3_1-P2
- SYS/PLT/NOR/P01/N02/UV3_1-P3
- SYS/PLT/SUR/P04/N01/UV2_6-P1
- SYS/PLT/SUR/P04/N01/UV2_6-P2
- SYS/PLT/SUR/P04/N01/UV2_6-P3
- SYS/PLT/SUR/P04/N01/UV2_7-P1
- SYS/PLT/SUR/P04/N01/UV2_7-P2
- SYS/PLT/SUR/P04/N01/UV2_7-P3
- SYS/PLT/SUR/P04/N01/UV2_8-P1
- SYS/PLT/SUR/P04/N01/UV2_8-P2
- SYS/PLT/SUR/P04/N01/UV2_8-P4
- NEX/RED/RSP/NNN/PRIMARY_AIR
- Logistics Train 01
- Auxiliary Compressor
- Cooling Tower
- Meeting Room
- Central Fire System
- HVAC 1ST FLOOR ADM
- HVAC OFFICES
- H.V.A.C._OFFICES
- Backup Server
- Technical Office
- Access Control
- LIGHT_N1_N2_N3
- LIGHT_FACADE
- LIGHT_N4
- Lighting (TOTAL)
- Services Panel
- Water Treatment Plant
- Real-time status
Each connection shows its current state: active (green) or down (red).
- Built-in search
Filtering by name across hundreds of connections.
- Full coverage
Brokers, buses, meters and process equipment, all in one list.
Error diagnosis What is failing and why
When a device goes down, Lynx shows the error detail — «Timed out», «not working», address and length — alongside the scan-cycle time window in which it was detected.
Scan cycle time window:18/6/2026, 17:40:00 --> 18/6/2026, 17:41:00
- West-Plant/LB1/Line2/Node4/UV1_5-P1- Timed out(address:4131,length:2)- not working
- East-Plant/Line1/Node3/UV1_6-P2- Timed out(address:4131,length:2)- not working
- Central-Plant/Packaging/Node3/UV1_2-P3- Timed out(address:4131,length:2)- not working
- South-Plant/Warehouse/Node4/UV2_2-P1- Timed out(address:4131,length:2)- not working
- North-Plant/Mixing/Node1/UV1_7-P2- Timed out(address:4131,length:2)- not working
- West-Plant/Boilers/Node5/UV1_3-P4- Timed out(address:4131,length:2)- not working
- East-Plant/Services/Node5/UV2_1-P4- Timed out(address:4131,length:2)- not working
- North-Plant/Laboratory/Node1/UV2_5-P1- Timed out(address:4131,length:2)- not working
- South-Plant/Treatment/Node6/UV2_3-P1- Timed out(address:4131,length:2)- not working
- Central-Plant/Utilities/Node2/UV1_7-P2- Timed out(address:4131,length:2)- not working
- Central-Plant/Workshop/Node2/UV1_4-P3- Timed out(address:4131,length:2)- not working
- South-Plant/Offices/Node6/UV2_4-P3- Timed out(address:4131,length:2)- not working
- Failure reason
Technical error message (timed out, not working) with address and length.
- Scan window
Timestamp of the cycle in which the fault was evaluated and detected.
- Grouped by site
Devices in error are listed under their corresponding country and plant.
NOBODY HAS TO ASK The report lands before anyone asks
Lynx generates periodic communications-status reports and emails them to the defined recipients. Period summary, comparison with the previous one, availability by hour and day and a breakdown per plant and asset.
- Automatic scheduled deliveryScheduling of the report (e.g. weekly) and definition of recipients.
- Error · Unstable · Stable summaryCount and percentage of assets per state, with the change versus the previous period.
- Availability by hour and dayA heatmap showing when communication drops across the period.
- Breakdown by plant and assetFull hierarchy per site, highlighting assets with significant incidents.
Current period · 09 Apr — 17 Apr 2026
- Error57 / 55310.3 %
- Unstable100 / 55318.1 %
- Stable393 / 55371.1 %
- Plant 184 %
- Plant 272 %
- Plant 391 %
- Plant 462 %
- Plant 594 %

Find out on Tuesday, not Thursday
We prepare a demo with the network at one of your sites and show you how Lynx watches the link to every asset.
Or write to us directly at support.dt@dominion-global.com